Motivation #
In Civil 3D, how can we show quantities like Road Elevation, Survey Surface Elevation and Grade Breaks ( the elevations at the interval where the road elevation changes) in the table row? I am talking about this:
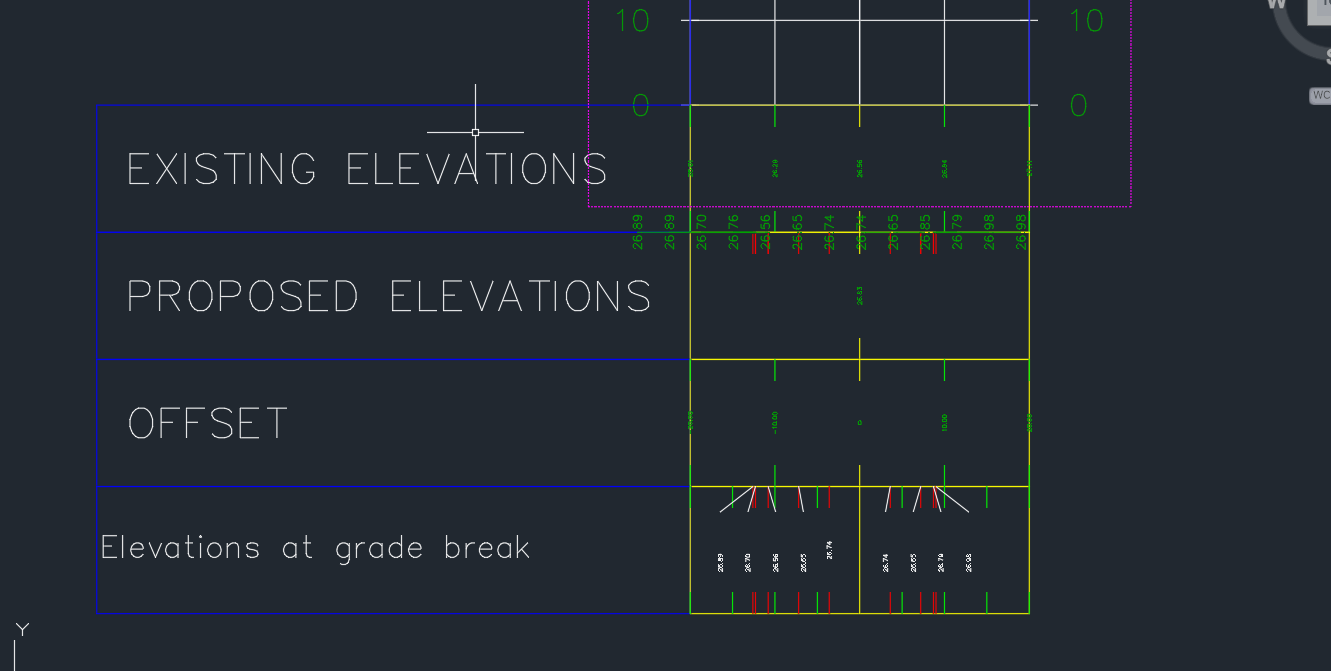
The aim of this user guide is to work you through the process, and at the same time explain what is the meaning of all the tables and rows, so that you can have an intuitive grasp of how this is done. Though we are using Grade Break as an example, but it should equally be applicable to other data source such as elevations or offsets
Bands and Table Rows #
The construction of table row for a section view is not intuitive at all in Civil 3D. You need to be familiar with the Band Style, Band Set Style concept.
Essentially, a band is a row in the table. In the example above, there are 4 bands– and hence, 4 rows– in total for the table: EG Elevations band style ( “Existing Elevations”), FG Elevations band style (“Proposed Elevations”), Offsets band style (“Offset”) and Elevations at grade break band style (“Elevations at grade break”).
Since we are interested in Grade Break, let’s try to see how we can do the configuration.
Right click on a Section View, choose Section View Properties... option.
Then, click on either Create New, or Copy Current Selection, as shown in the screenshot below
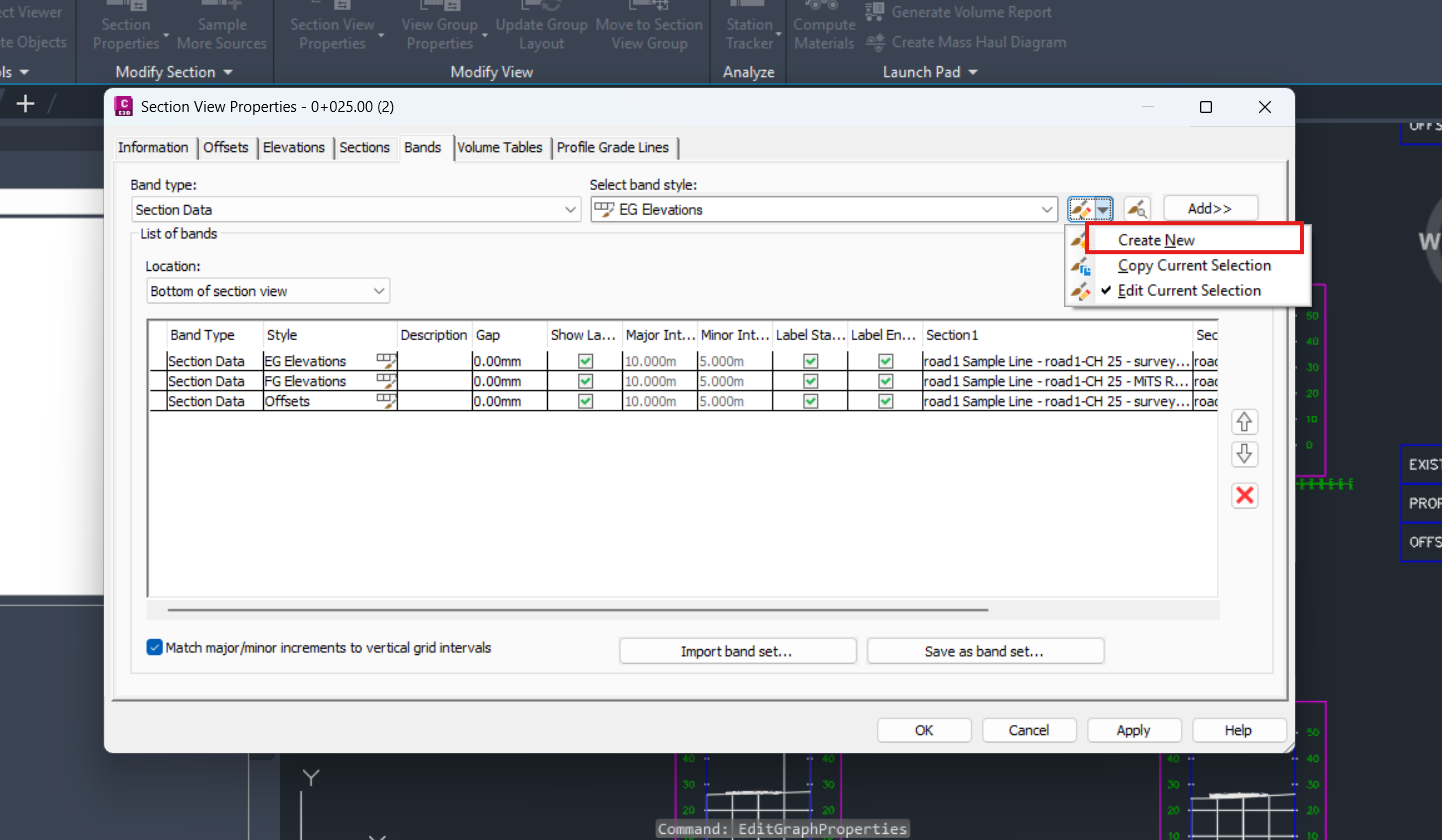
Either options will do. But you might want to copy current selection and modify from there. It may prevent unforeseen errors.
Section Data Band Style/Band Details #
Now we are at Section Data Band Style table. This is a confusing table so it needs some detailed explanations.
There are only two tabs that we need to focus on: the Band Details and Display tab. Let’s look at the Band Details tab first, it contains two main columns, Title text and Labels and ticks column.
Title text contains the information on how you can configure for the table title ( like the “Existing Elevations” on the first row). When you click on the Compose label.. button, it will bring you to another dialog box that allows you to configure the text appearance of the table title.
Labels and ticks contains the information on how you can configure for the table values ( like the numerical values for Offsets or Elevations). You can’t simply show anything you want; only those that are already predefined, which is Major Increment, Minor Increment, Centerline, Sample Line Vertices, Grade Breaks, Incremental Distance. In other words, just what you will see in the Section Data Band Style, under Band Details tab, and the Labels and ticks section, as shown below:
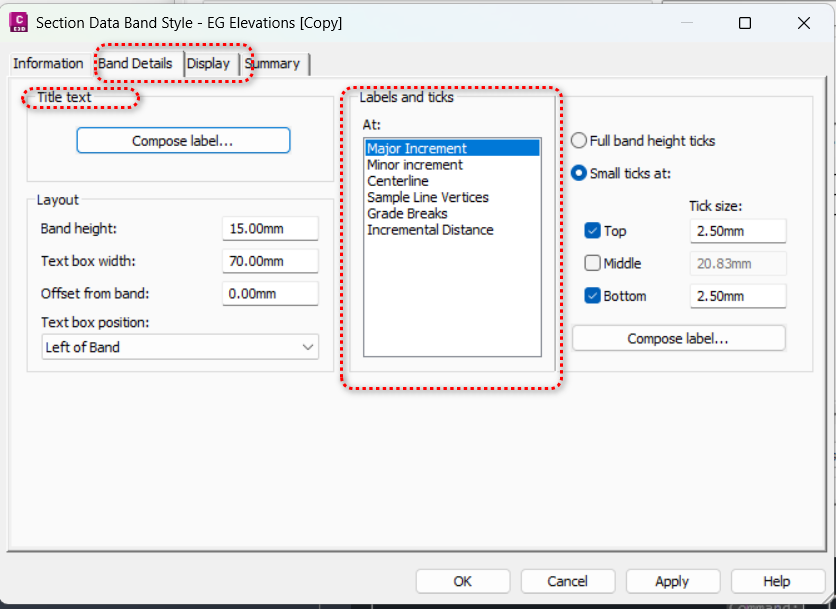
Ignore for now everything except for the Grade Breaks option, click on Compose label... button, this is the same configuration that configures the Title text label. This Grade Breaks will only configure for Grade Break, and won’t configure for other fields like Offsets.
Label Style Composer #
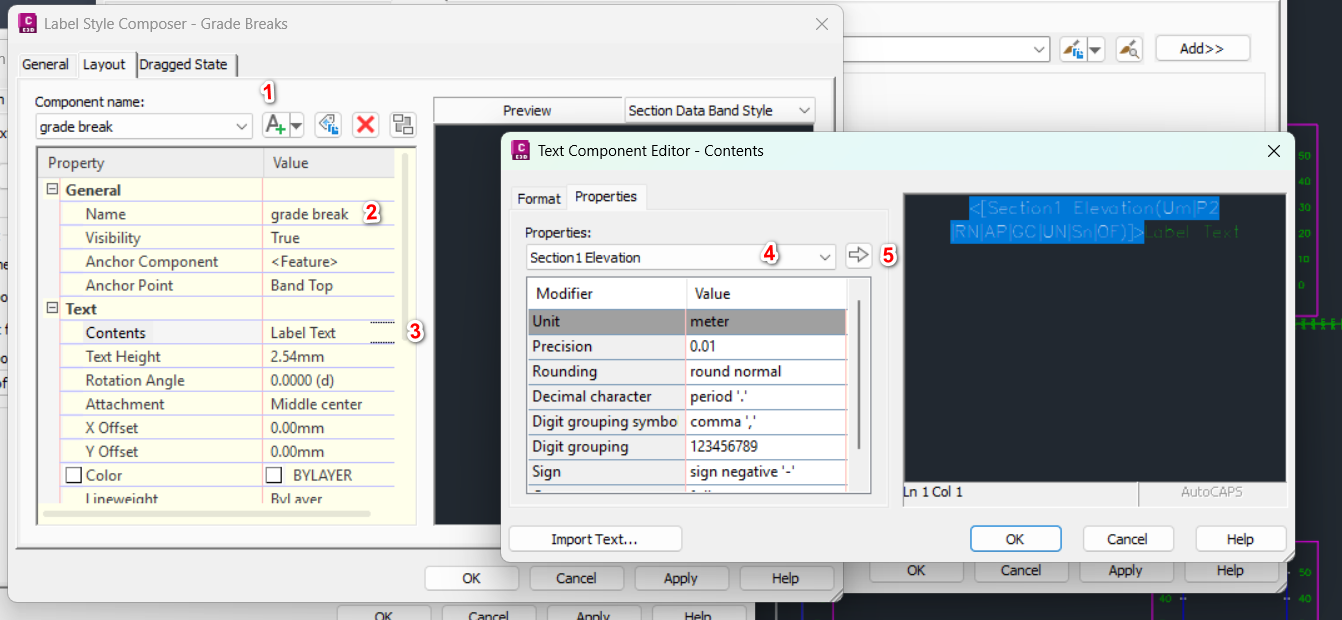
This brings us to Label Style Composer dialog box, where you can configure the text. So, the first step is to define a Text Component. You can do this by clicking on the “A+” sign ( “1” in the screenshot).
Then we assign it a name, let’s call it grade break as shown in the screenshot below (“2”). This name will not affect any display, it is used internally only.
You may configure other options, such as X Offset, Y Offset. But let’s move on to the actual content. Namely, how can we ensure that it shows what we want? To configure this, we need to click on the button at the Contents property ( “3”).
 .
.
Text Component Editor #
This brings us to Text Component Editor dialog box, where we can define the “source” of the data.
What you see on the black panel on the right hand side is exactly what will be shown as table values in numerical format. So it’s advisable that the very first step is to delete everything on the black panel before you add in your own content.
Then, for Grade Break you must pick Section 1 Elevation ( “4”) and click on the Arrow (“5”) button to copy the values to the black panel. The Section 1 Elevation draws the data from what we define in the Section 1 column in the Section View Properties dialog box, as we will see again this later.
 .
.
It’s not recommended that you edit the black panel manually, unless you know very well what you are doing.
If you want to change any configuration ( such as changing the Unit from meter to something else), remember to clear everything on the black panel, and then click on the Arrow (“5”) button so that new configuration can be copied over and applied properly.
Section Data Band Style/Display #
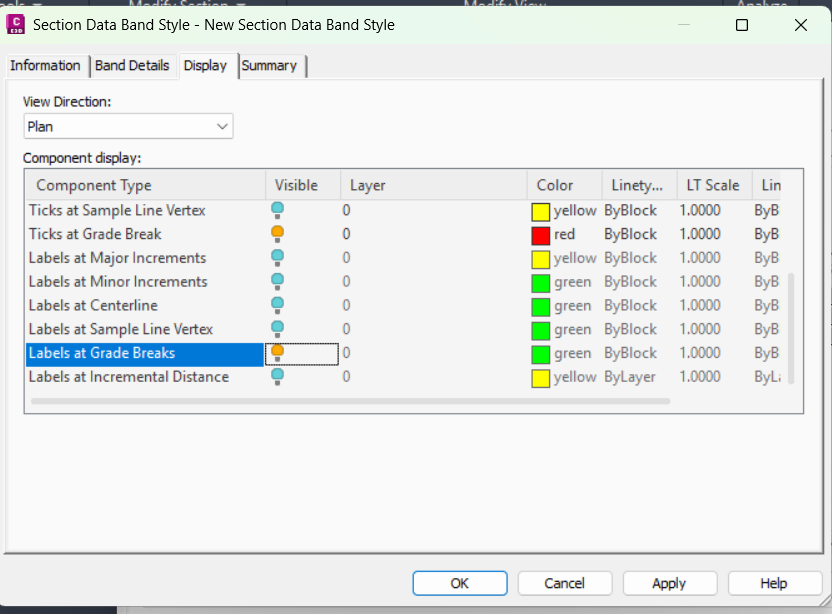
Click OK or Apply all the way, until you reach back to Section Data Band Style. Now, we need to focus on Display tab. This tab basically contains the layer information for all the labels components like Major Increment, Minor Increment etc. To ensure no confusion, you have to make sure that for Grade Breaks band style, only Ticks and Labels for Grade Breaks are set to visible. Yes, the Ticks and Labels for Major Increments and all should have the Visible set to false to avoid unwanted interference at the Grade Breaks band.
Ditto for all other bands.
Click OK to go back to the Section View Properties
Section View Properties, again #
At Section View Properties, make sure you Add the newly configured band to the List of bands, and configure the Section 1 to the Road Datum Surface ( or the survey surface if that’s what you want). This is where the table row will draw the data from: the Road Datum Surface at Grade Break interval
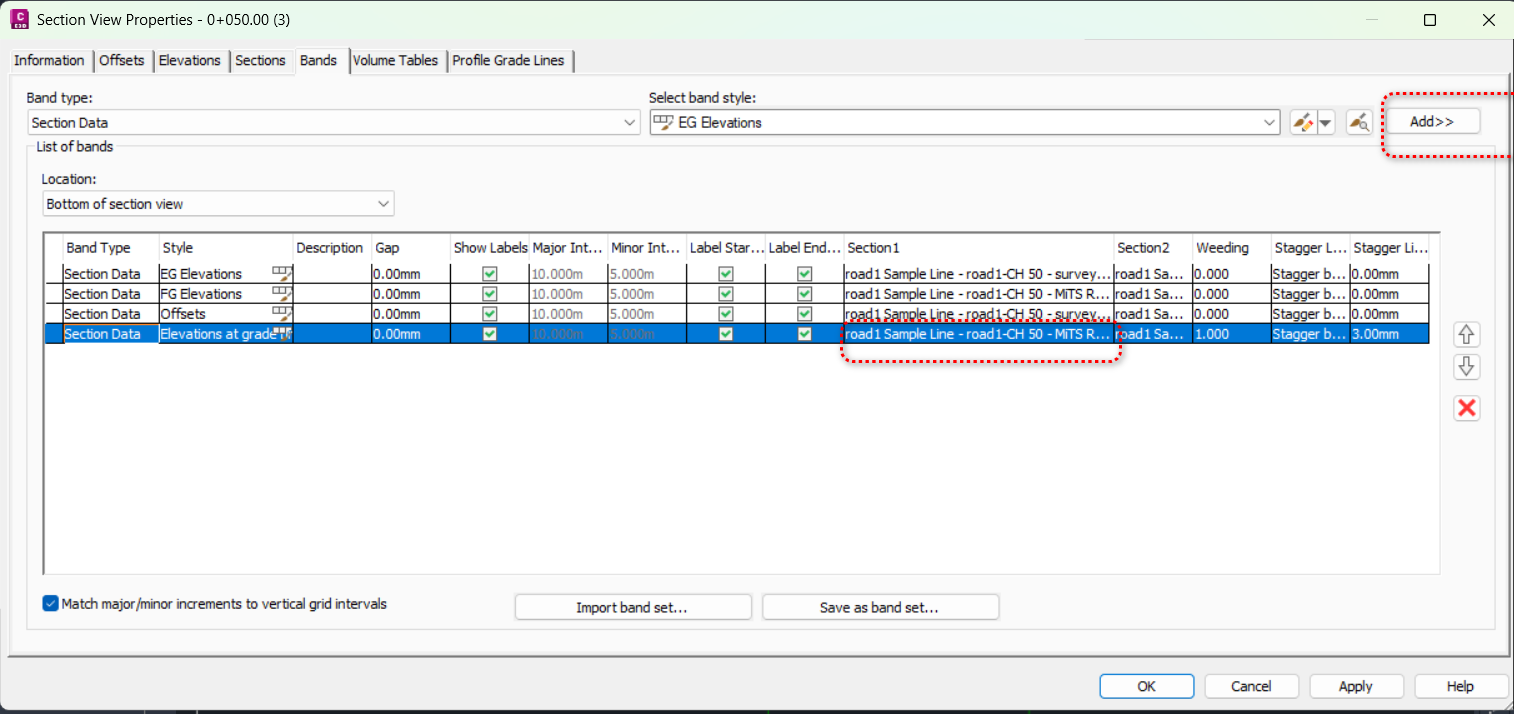
There are other columns like Weeding and Stagger *. They mainly control the appearances of the table row ticks. You can experiment them to see how they affect the appearances of the tables.
So, as long as you have the Elevations at grade break style as a band, then the Grade Break values will show in the table as shown below:


